Gentrified Pixel
Research, Images, 61 seconds video, 2017
According to the prediction from Media, AI will replaces many repetitive and standard jobs and it might related to the unemployment rate. Here come up with a question, will the development of AI enlarge the gap between rich and poor? In economics, the Gini index is a measure of statistical dispersion intended to represent the income or wealth distribution of a nation’s residents, and is the most commonly used method of inequality, the maximum Gini index is “1” and the minimum is “0”. Usually, the UNDP uses 0.4 as the “warning line”. When the line has been exceeded, the polarisation between the rich and the poor can easily lead to social class opposition and social chaos. According to the report by China Southwestern University of Finance and Economics China Southwestern University of Finance and Economics and the Social Survey Center of Beijing University, believing in 2012 the Gini index has already reached 0.73 (the index which government announced was 0.469).Social conflicts caused by gentrification have always been the discussed issues in urban planning.
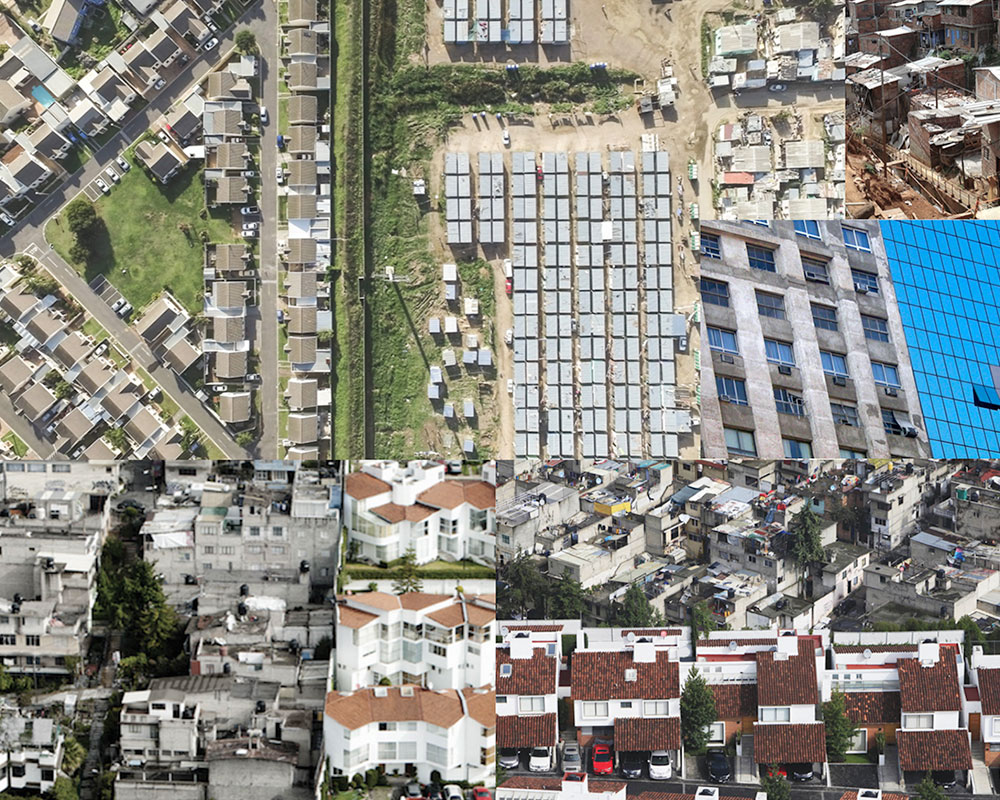
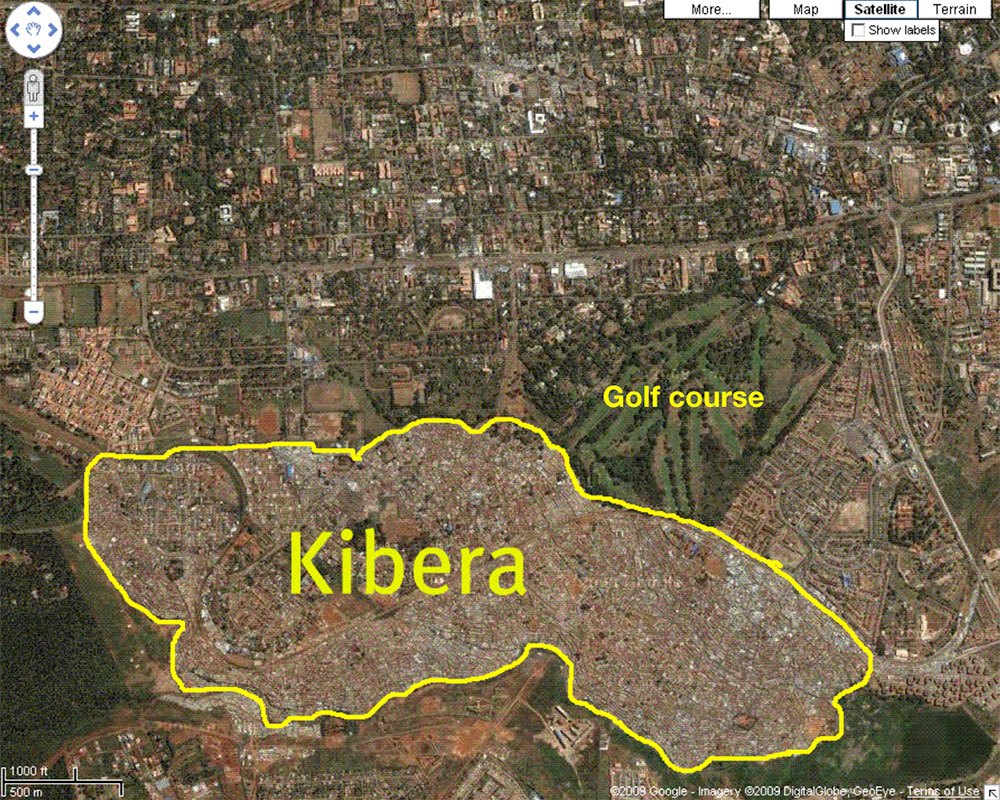
The map serves as the carrier of information, records these traces, city as a changeable body, the buildings, streets, and the greening are the elements which are shaping it. The urban texture is a combination of the material arrangement, like DNA code shows how urban developed and might somehow reflect the economic status.
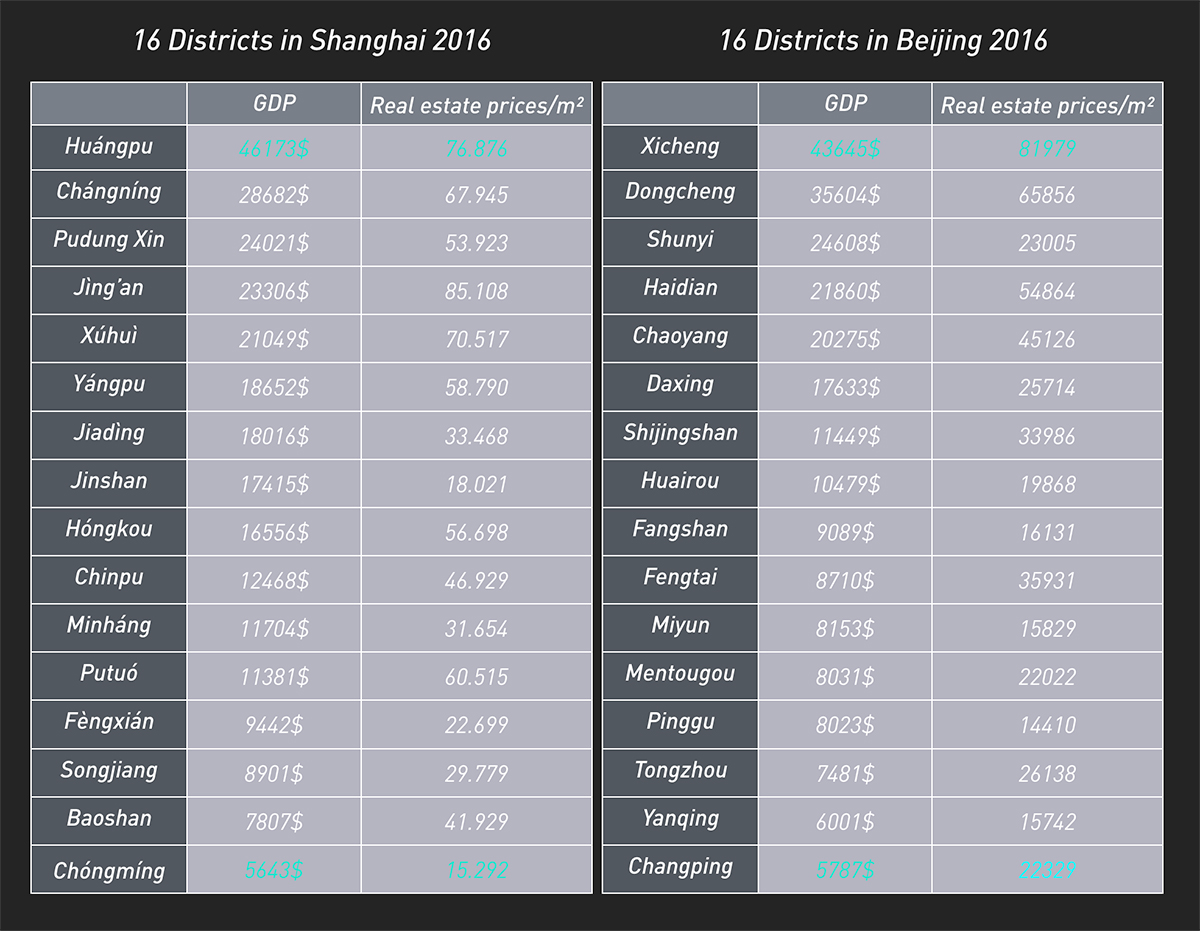
In this project , I collected per capita GDP of 16 districts in Shanghai, Beijing and satellite images from those areas, took them as a database. After neural network training, I got the architectural texture of each area, which represents the value of the district. The outcome of those images can be regarded as a mirror that interpreted not only GDP values but also the imagination of future city.
The composition of urban texture


Urban data

Deep neural network
The architectural texture of the area. So far, a total of 32 districts have been calculated, I named these images with GDP value.
Here take GDP 17415 $ as an example.